The Problem with Manual Reporting

Support organizations generate enormous amounts of operational data but turning that information into meaningful insights is often difficult. Managers frequently spend hours exporting reports, updating spreadsheets, and calculating key metrics, only to discover the data is already outdated.

Without real-time visibility, rising ticket volumes, declining response times, missed SLAs, and uneven agent workloads can go unnoticed until they begin affecting customer satisfaction.

How Reporting & Analytics Works

1

Every ticket processed in SutiDesk automatically captures timestamps, status updates, assignments, response activity, and resolution history.

2

The platform continuously calculates key performance indicators (KPIs), including response times, resolution times, SLA compliance, ticket volume, and customer satisfaction.

3

Performance metrics can be analyzed by agent, team, department, communication channel, priority, or custom time period.

4

Interactive dashboards update automatically as support activity occurs, providing a real-time view of operational performance.

5

Managers use these insights to identify bottlenecks, balance workloads, improve staffing decisions, monitor service quality, and optimize support processes.

Key Features

Real-Time Performance Dashboards

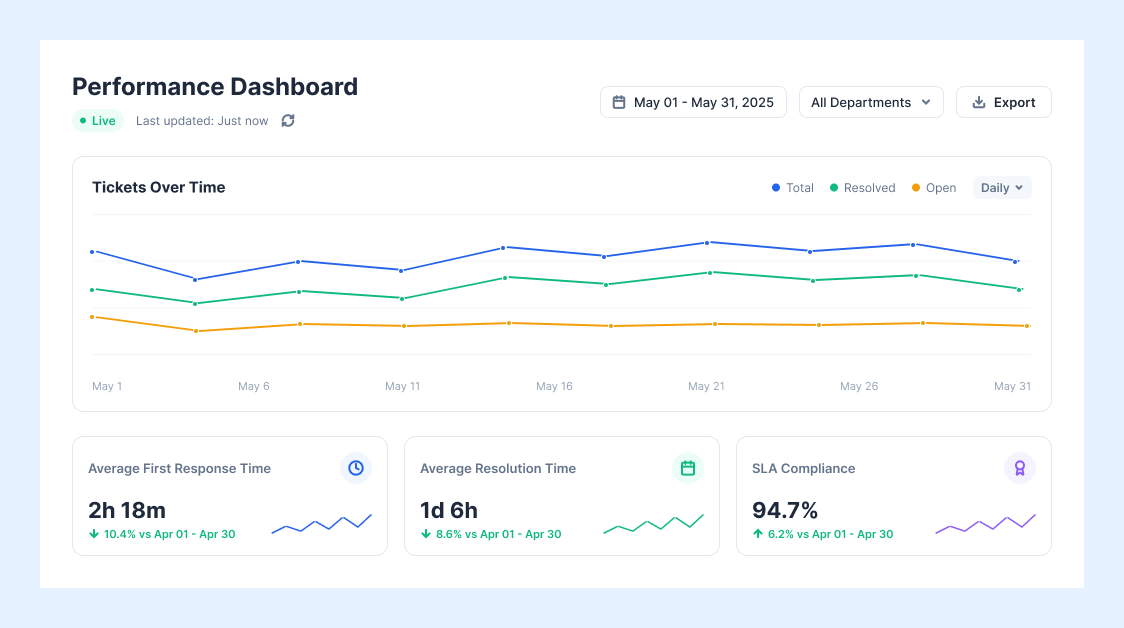
Monitor ticket volume, response times, resolution rates, SLA performance, and other critical metrics through live dashboards that update automatically as work is completed.

Automatic SLA Tracking

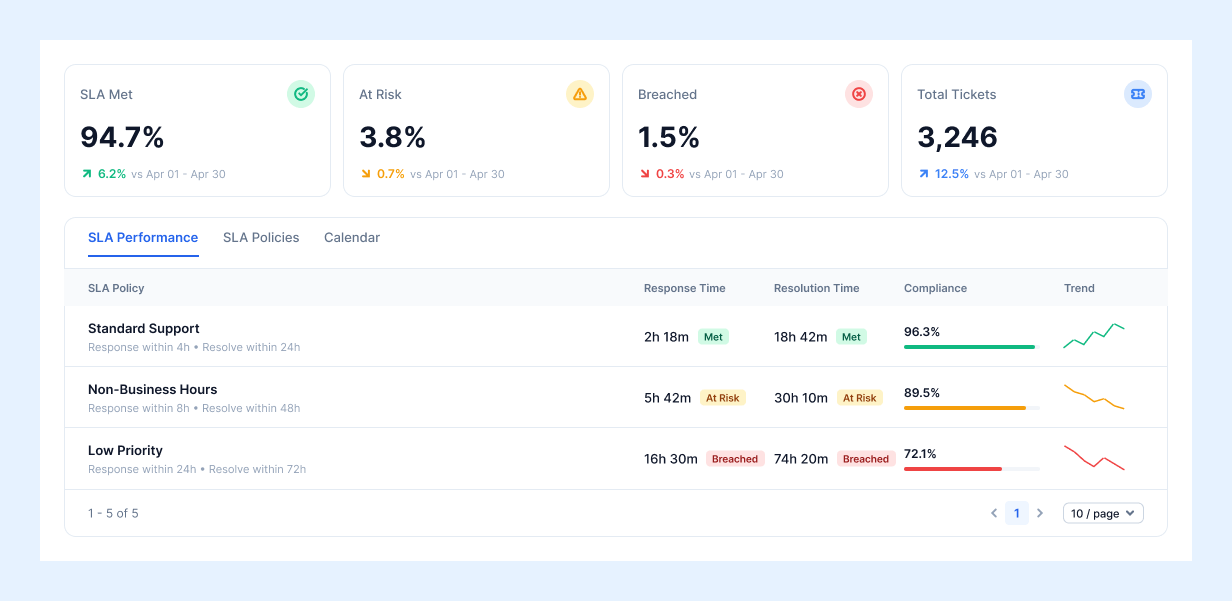
Track response and resolution performance against service level agreements without manually comparing timestamps or maintaining external reports.

Agent Performance Insights

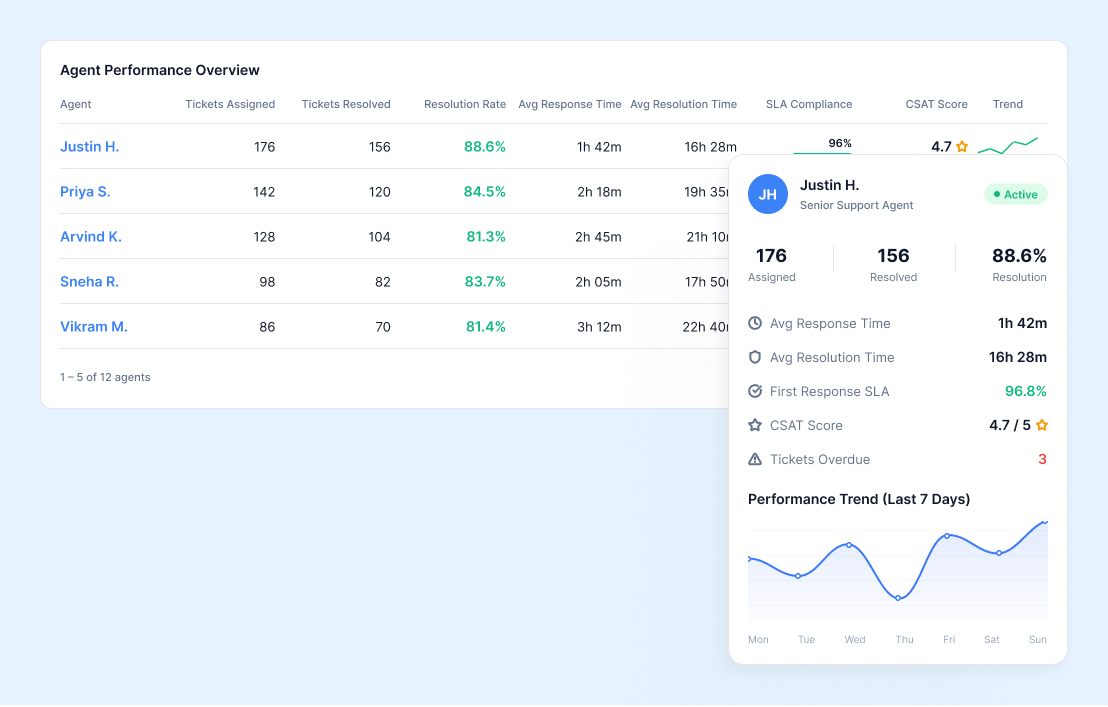
Measure productivity, workload, response times, and resolution metrics for individual agents, making it easier to recognize top performers and identify coaching opportunities.

Customer Satisfaction Reporting

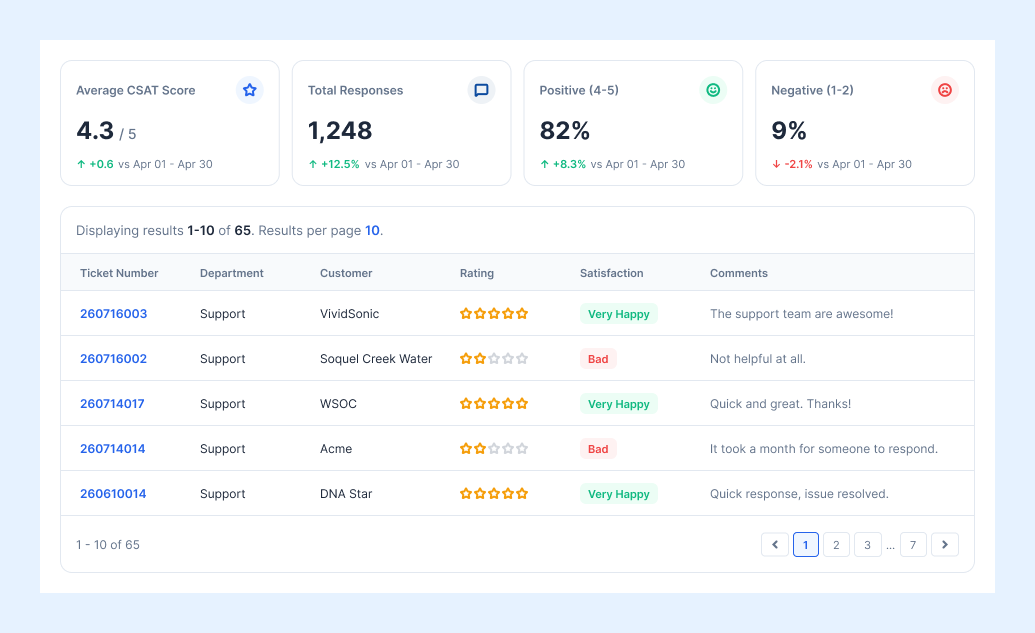
Analyze customer satisfaction alongside operational KPIs to better understand how service performance impacts the overall customer experience.

Channel Performance Analytics

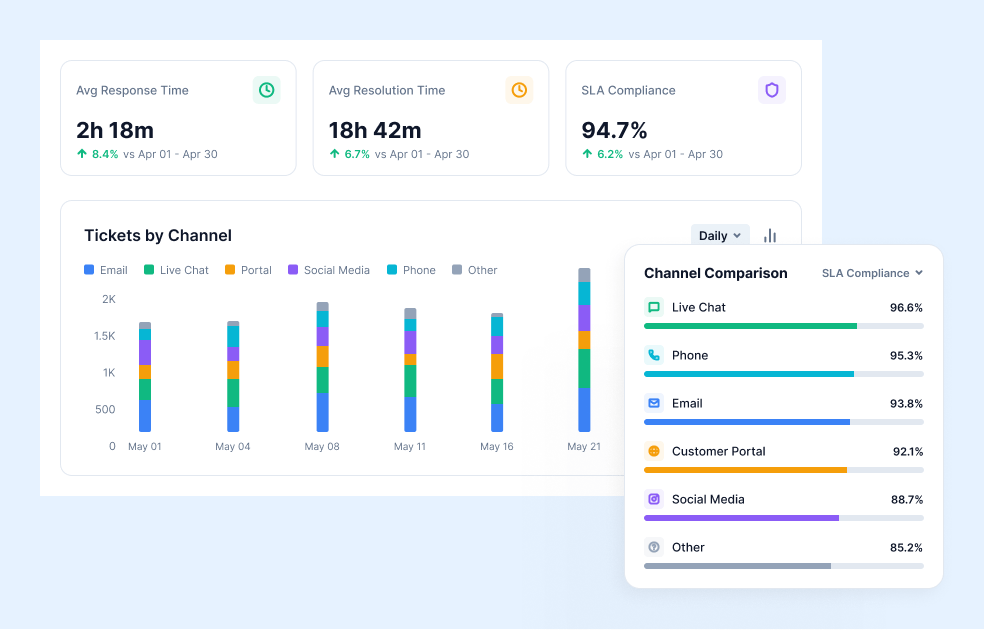
Compare ticket volume and performance across email, live chat, customer portals, social media, phone, and other communication channels to better allocate resources.

Historical Trend Analysis

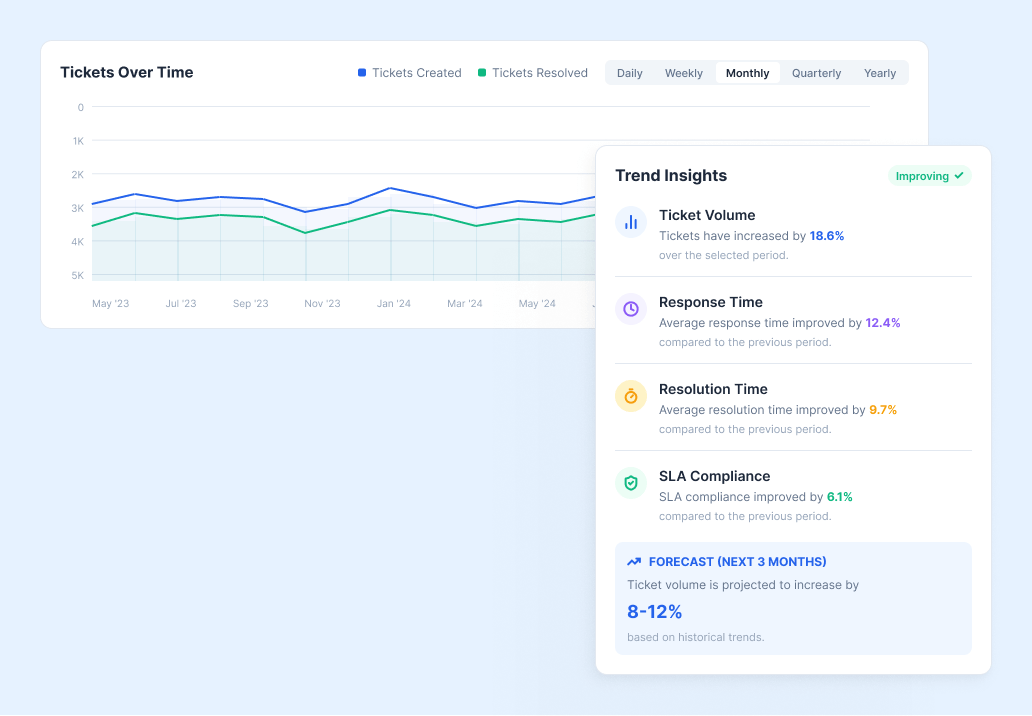
Monitor performance over days, weeks, months, or years to identify long-term trends, forecast support demand, and proactively improve operations.

How It Makes a Difference

Example Use Case

A support manager at a growing software company previously spent several hours every week exporting ticket data and building spreadsheets to measure response times and SLA performance.

With SutiDesk Reporting & Analytics, those metrics are available instantly through live dashboards that update automatically throughout the day. Instead of creating reports, the manager can immediately identify workload imbalances, monitor SLA compliance, recognize high-performing agents, and make proactive staffing decisions before service levels decline.

See How Sutidesk Reporting & Analytics Helps You Measure What Matters and Continuously Improve Your Customer Support Operations

Frequently Asked Questions

SutiDesk tracks a wide range of support metrics, including ticket volume, first-response time, resolution time, SLA compliance, agent productivity, customer satisfaction, workload distribution, and performance trends across teams and communication channels.

Yes. Dashboards update automatically as tickets progress through their lifecycle, providing managers with an accurate, real-time view of current support performance.

Absolutely. SutiDesk provides detailed agent-level reporting, allowing managers to evaluate productivity, response times, resolution rates, workloads, and other performance indicators to support coaching and recognition.

Yes. Performance data can be viewed by email, live chat, customer portals, social media, phone, and other supported channels, making it easy to compare service levels and identify trends across customer touchpoints.